
How to Test and Debug A Program
In previous article, common errors of a program divided by three general categories. Syntax errors, run-time errors, and logic errors. Sometimes the cause of error can be fixed easily. However, you may spend considerable time and energy locating it. The first step in locating/identifying a hidden error is to examine the program output to know which part of the program is generating incorrect result. After locating it, then you can focus on the statement which are at fault. Error in programs called “bugs“, so in order to fixing the bug we need to debug it.

There are two ways to debugging a program that we will discussed here :
- Using Debugger Programs
- Debugging without using debugger programs
Debug A Program by Using Debugger Programs
Debugger (debugging tool) is a software that is used to test and debug other program. The debugger program allows you to execute your program one by one line statement at a time (single step execution). Through Single-step execution, you can observe each statement of your program, validating loop control variables, and other important variables. A Debugger have a feature to separating your program into segments by setting breakpoints through the code. You should set a breakpoint at the end of each major function algorithm step. Then execute the program through debugger from the last breakpoint up to the next breakpoint. So it’s easier to find a bug if you can check how the program works step by step.
List of Debuggers
Here is a list of debuggers you can use to debug a program.
- GNU Debugger (GDB), Standard debugger for the GNU operating system.
- Intel Debugger (IDB), Developed by intel for debugging programs written in C, C++, and fortran.
- LLDB, High-performance debugger from LLVM project.
- Microsoft Visual Studio Debugger, a debugger that includes along with all version of microsoft visual studio.
- Valgrind, a GPL licensed programming tool for memory debugging, memory leak detection, and profiling.
- WinDbg, a multi-purpose debugger for Microsoft Windows.
Debug A Program Without a Debugger
Most people who can’t use a debugger asking how to debugging program without using debugger. If you cannot use a debugger tools, you can debug it from source code by inserting extra diagnostic calls to printf that display intermediate results at critical points in your program. To make it easy, you can display the values of variables affected by each major function and algorithm step before and after the step executes. After that, you can compare its result to determine bugs location.
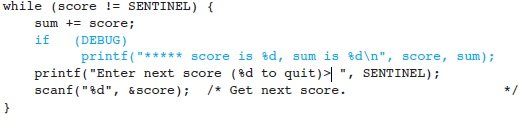
An Example of diagnostic calls
From example above, you can set debug mode active or not by defining the DEBUG value
|
1
|
#define DEBUG 1 /*for activating debug mode*/
|
or
|
1
|
#define DEBUG 0 /*for deactivating debug mode*/
|
Becareful when you inserting diagnostic calls to printf if the statement inside an if or while statement.
You May Want to See :
-
 Tools You Need For Virtualisation
-
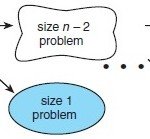 Recursive Function in Program
-
 Variables and Types – Python Programming
-
 How Botnets Infiltrate & Exploit Computer Systems
-
R vs Python, Which one is better
-
 Using Laser for Welding
-
 Connecting Ruby to Java Programming
-
 Software Tools For Building Electronics
-
 Handling with Objects and Classes in PHP
-
 What is CSS and What CSS can do ?
-
 User Defined Functions in MySQL
-
 String Functions PHP
-
 3 Common Programming Errors
-
 Parallel Programming with Multiprocess and Threads
-
 Basic Guide of Interprocess Communication and Pipes
-
 How To Create a Web Crawler and Data Miner
-
 How To Create a Simple Search Engine
-
 Hardening MySQL Security Server
-
 Tips Choosing Best Suitable Hosting Company For You
-
 How to program ghost notes for your MIDI drum tracks
-
 Understanding the basics of HTML


