
Wireshark Tutorial to Analyse traffic
Wireshark is a very popular and extremely capable network protocol analyser that was developed by Gerald Combs. Wireshark was born in June 2006 when Combs renamed the network tool Ethereal, which he also created, as he was changing jobs and couldn’t use the old name anymore. Nowadays, most people use Wireshark and Ethereal has been consigned to history. If you’re using Linux. Your Linux distribution will have a ready to install package for analyser too, so go ahead and install it.
 You may ask what makes Wireshark different to other network analysers – apart from the fact that it’s free – and why we’re not simply advocating using tcpdump for packet capturing? The main advantage of Wireshark is that it’s a graphical application. Capturing and inspecting network traffic using a graphical user interface is a very helpful thing because it cuts through the complexity of network data.
To help the beginner understand Wireshark they will need to understand network traffic. The aim of this article then is to supply a comprehensive introduction to TCP/IP to enable you to come to useful conclusions about the network traffic data you’re analysing.
If you run Wireshark as a normal user, you won’t be able to use any network interfaces for capturing, because of the default Unix file permission that network interfaces have. It’s more convenient to run Wireshark as root (sudo wireshark) when capturing data and as a normal user when analysing network data. Alternatively, you can capture network data using the tcpdump command line utility as root and analyse it using Wireshark afterwards. Please keep in mind that on a truly busy network, capturing using Wireshark might slow down a machine or, even worse, might not enable you to capture everything because Wireshark needs more system resources than a command line program. In such cases using tcpdump for capturing network traffic is the wisest solution.
Capturing network data
The easiest way to start capturing network packets is by selecting your preferred interface after starting Wireshark and then pressing Start. Wireshark will show network data on your screen depending on the traffic of your network. Note that you can select more than one interface. If you know nothing about TCP, IP or the other TCP/IP protocols, you may find the output complicated and difficult to read or understand. In order to stop the capturing process you just select Capture > Stop from the menu. Alternatively, you can press the fourth icon from the left, the one with a red square (which is shorthand for ‘Stop the running live capture’) on the Main toolbar (Note: its exact location depends on your Wireshark version). This button can only be pressed while you are capturing network data.
When using the described method for capturing, you can’t change any of the default Wireshark Capture Options. You can see and change the Capture Options by selecting Capture > Options from the menu. There you can select the network Interface(s), see your IP address, apply capture filters, put your network card in promiscuous mode, and save your capture data in one or multiple files. You can even choose to stop packet capturing after a given number of network packets or a given amount of time or indeed a given size of data (in bytes).
Wireshark doesn’t save the captured data by default but you can always save your data afterwards. It’s considered good practice to first save and then examine the network packets unless there’s a specific reason for not doing so.
Wireshark enables you to read and analyse already captured network data from a large amount of file formats including tcpdump, libpcap, Sun’s snoop, HP’s nettl, K12 text file etc. This means that you can read almost any format of captured network data with Wireshark. Similarly, Wireshark enables you to save your captured network data in a variety of formats. You can even use Wireshark to convert a file from a given format to another.
You can also export an existing file as a plain text file from the File menu. This option is mainly for manually processing network data or using it as input to another program.
There is an option that allows you to print your packets. I have never used this option in real life but it may be useful to print packets and their full contents for educational purposes.
Display filters
While capture filters are applied during network data capture and make Wireshark discard network traffic that doesn’t match the filter, display filters are applied after capture and ‘hide’ network traffic without deleting it. You can always disable a Display filter and get your hidden data back.
Generally, display filters are considered more useful and versatile than capture filters because it’s unlikely you’ll know in advance what you’ll capture or want to examine. Nevertheless, applying filters at capture time can save you time and disk space and that’s the main reason you might want to use them.
Wireshark will highlight when a display filter is syntactically correct with a light green background. When the syntax is erroneous, the background becomes pink.
Display filters support comparison and logical operators. The http.response.code == 404 && ip.addr == 192.168.1.1 display filter shows the traffic that either comes from the 192.168.1.1 IP address or goes to the 192.168.1.1 IP address that also has the 404 (Not Found) HTTP response code in it.
The !bootp && !ip && !arp filter excludes BOOTP, IP and ARP traffic from the output. The eth.addr == 01:23:45:67:89:ab && tcp.port == 25 filter displays the traffic from or to network device with the 01:23:45:67:89:ab MAC address that uses TCP port number 25 in its incoming or outgoing connections.
Keep in mind that display filters don’t magically solve problems. They are extremely useful tools when used correctly but you still have to interpret the results, find the problem and think about the possible solutions yourself.
When defining rules please remember that the (ip.addr != 192.168.1.5) expression doesn’t mean that none of the ip. addr fields can contain the 192.168.1.5 IP address. It actually means that one of the ip.addr fields should not contain the 192.168.1.5 IP address. Therefore, the other ip.addr field value can be equal to 192.168.1.5. You can think of it as ‘there exists one ip.addr field that is not 192.168.1.5’. The correct way of expressing it is by typing !(ip.addr == 192.168.1.5). This is a common misconception.
Also remember that MAC addresses are truly useful when you want to track a given machine on your LAN because the IP of a machine can change if it uses DHCP but its MAC address is more difficult to change.
It is advisable that you visit the display filters reference site for TCP related traffic at Wireshark TCP Documents. For the list of all the available field names related to UDP traffic, it’s advisable to look at Wireshark UDP Documents.
About TCP/IP, TCP and IP
TCP/IP is the most widely used protocol for interconnecting computers and it is so closely related to the internet that it’s extremely difficult to discuss TCP/IP without talking about the Internet and vice versa. Every device that uses it has:
- An IP address This address must be unique at least to its local network.
- A network mask Used for dividing big IP networks into smaller networks that’s related to the current network,
- One or more DNS servers Used for translating an IP address to a human-memorable format and vice versa A Default Gateway This is optional if you want to communicate with devices beyond your local network.
- A Default Gateway is the network device that TCP/IP sends a network packet to when it doesn’t ‘know’ where else to actually send it.
Every TCP service listens to a port that is unique to each machine. A machine that supports the HTTP protocol, the protocol that serves WWW, is also called an HTTP server. Similarly there exist FTP servers, DNS servers, etc. It’s the two pairs of the IP addresses and port numbers on both ends of a TCP/IP interaction that uniquely identify a connection between two machines that use TCP/IP.
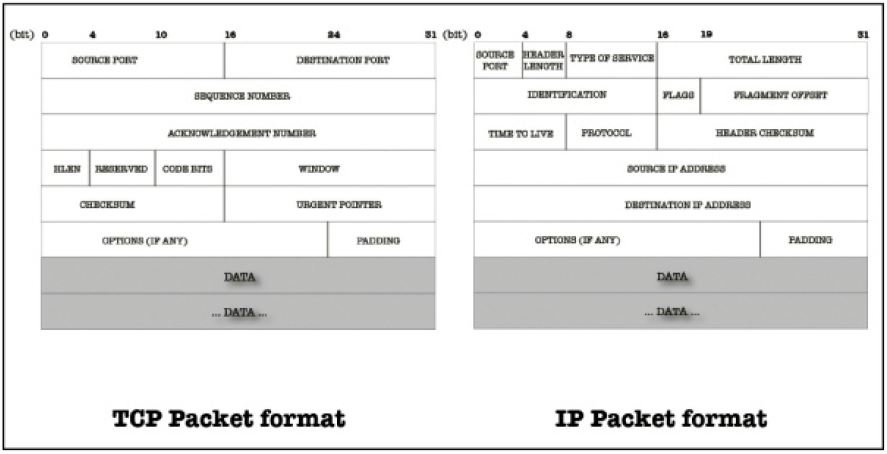
A TCP packet (see the format of a TCP and an IP packet segment, pictured above) can be used to establish connections; transfer data; send acknowledgements, advertise the buffer that holds incoming data, which is called Window Size, and close connections. Each TCP segment has a header part and a data part.
The TCP 3-way handshake
TCP provides a connection-oriented, reliable byte stream service. It’s a full duplex protocol, which means that each TCP connection supports a pair of byte streams; one flowing in each direction. The term ‘connection-oriented’ means the two applications using TCP must first establish a TCP connection with each other before exchanging any data.
The TCP header includes a 6-bit flags field that’s used to relay control information between TCP peers. The possible flags include SYN, FIN, RESET, PUSH, URG, and ACK. SYN and ACK flags are used for the initial TCP 3-way handshake as you will see in a while. The RESET flag signifies that the receiver wants to abort the connection.
The TCP three-way handshake goes like this: the client sends a TCP SYN packet to the server, and its TCP header includes a sequence number field that has an arbitrary value in the SYN packet. The server sends back a TCP (SYN, ACK) packet which includes the sequence number of the opposite direction and an acknowledgement of the previous sequence number. Finally, in order to truly establish the TCP connection, the client sends a TCP ACK packet to acknowledge the sequence number of the server. After the TCP three-way handshake, the connection is established and is ready to send and receive data.
The traffic for this case was produced by running the following command:
|
1
|
$ wget http://technotif.com/
|
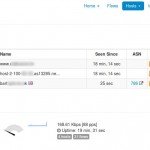
After some necessary DNS, ARP and ICMP network traffic, the TCP three-way handshake begins (which you can see image below). The client IP address is 10.0.2.15 and the destination IP address is 80.244.178.150. A pretty simple display filter (tcp && !http) makes Wireshark display 63 out of 82 packets. The three packet numbers used in the handshake are sequential because the host wasn’t performing any other network activity at the time of capturing, but this is rarely the case.

Ping scans
This part will examine the network traffic that’s produced by Nmap when it performs a ping scan. LAN ping scans are executed using the ARP protocol. Hosts outside a LAN are scanned using the ICMP protocol, so if you execute a Nmap ping scan outside of a LAN, the traffic will be different from one presented. In the example below, the Nmap command scans 255 IP addresses, from 10.67.93.1 to 10.67.93.255. The results show that at execution time only 10 hosts were up or, to be precise, only ten hosts answered the Nmap scan:
|
1
2
3
4
5
6
7
8
9
10
11
12
13
14
15
16
17
18
19
20
21
22
23
24
25
26
27
28
29
30
31
32
33
34
35
36
37
38
39
40
41
42
43
44
45
46
47
48
49
50
51
52
53
54
55
56
57
58
59
60
61
62
63
|
$ sudo nmap -sP 10.67.93.1-255
Starting Nmap 6.47 ( http://nmap.org ) at 2014-09-05 11:51 EEST
Nmap scan report for xxxxx.yyyyy.zzzzz.gr (10.67.93.1)
Host is up (0.0030s latency).
MAC Address: 64:70:02:AD:E9:44 (Tp-link Technologies CO.)
Nmap scan report for srv-gym-ag-anarg.att.sch.gr (10.67.93.10)
Host is up (0.0051s latency).
MAC Address: 00:0C:F1:E8:1D:6E (Intel)
Nmap scan report for 10.67.93.20
Host is up (0.0066s latency).
MAC Address: D0:27:88:1D:15:20 (Hon Hai Precision Ind. Co.Ltd)
Nmap scan report for 10.67.93.21
Host is up (0.0053s latency).
MAC Address: D0:27:88:1D:D6:FB (Hon Hai Precision Ind. Co.Ltd)
Nmap scan report for 10.67.93.22
Host is up (0.0080s latency).
MAC Address: 00:1A:92:44:D7:67 (Asustek Computer)
Nmap scan report for 10.67.93.29
Host is up (0.057s latency).
MAC Address: 00:78:E2:47:49:E5 (Unknown)
Nmap scan report for 10.67.93.78
Host is up (0.0023s latency).
MAC Address: 00:80:48:24:6A:CC (Compex Incorporated)
Nmap scan report for 10.67.93.147
Host is up (0.028s latency).
MAC Address: 00:14:38:64:5D:35 (Hewlett-Packard)
Nmap scan report for 10.67.93.172
Host is up (0.016s latency).
MAC Address: 00:50:27:00:E4:F0 (Genicom)
Nmap scan report for wwww.yyyyy.zzzzz.gr (10.67.93.11)
Host is up.
Nmap done: 255 IP addresses (10 hosts up) scanned in 1.25 seconds
|
The purpose of the ping test is simply to find out if an IP is up or not. What’s important for Nmap in a ping scan is not the actual data of the received packets but, put relatively simply, the existence of a reply packet. As all traffic is in a LAN, each network device uses its MAC address in the reply so you only see MAC addresses in both Source and Destination fields. The presence of a reply makes Nmap understand that a host is up and running. As a MAC address includes information about the manufacturer of the network device, Nmap also reports that information for you.
Nmap also calculates the round trip time delay (or latency). This gives a pretty accurate estimate of the time needed for the initial packet (sent by Nmap) to go to a target device, plus the time that the response packet took to return to Nmap. A big latency time is not a good thing and should certainly be examined.
As it happens with most tools, the more you use Wireshark, the more efficient you will become with it, so keep on practicing and learning!
You May Want to See :
-
 Creating Simple TCP/IP Server And Client to Transfer Data Using C# / VB.net
-
 Hacking Wireless Networks
-
 MSI R9 380 Gaming 2GB
-
 ASUS ROG GX700
-
 Canonical launches Fan network system
-
 Creating Simple UDP Server And Client to Transfer Data Using C# / VB.net
-
 Why is Exchange Mailbox Not Receiving Email from External IDs?
-
 Email Header Forensic Analysis
-
 Fallout Shelter
-
 How to Install NTOPNG, A Web-Based Network Traffic Analysis Tool
-
 Hacking Wi-Fi with Kali Linux
-
 Extend Your Wordpress Theme With WP Child Themes
-
 How To Connect Raspberry Pi To A Network
-
 Stay Safe on Public Wi-Fi
-
 Choosing an OS for your Raspberry Pi
-
 Finding Vulnerabilities In Network Systems
-
 8 Ways To Optimise Your Wordpress Site
-
 Building A Website With Phoenix Framework
-
 How to Integrate Payments with Stripe API
-
 10 Tips to Speed Up Your Home Networking Connection
-
 Secure your site with a free SSL Certificate


