
How to Install NTOPNG, A Web-Based Network Traffic Analysis Tool
You can use this tool to monitor various protocols, traffic variants, and bandwidth across multiple time frames. Just like wireshark, It is based on libpcap and it has been written in a portable way in order to virtually run on every Unix platform, MacOSX and on Win32 as well. Here is the step by step installation guide for Ntopng for Ubuntu 14.04 server.
STEP 1
First of all add Ntopng repo in your Ubuntu repo list. Create ntop.list file by running the command:
|
1
|
sudo nano/etc/apt/sources.list.d/ntop.list
|
Then add this line:
|
1
2
|
deb http://www.nmon.net/apt-stable/12.04/ x64/
deb http://www.nmon.net/apt-stable/12.04/ all/
|
STEP 2
Run the given command to add the key and then run update:
|
1
2
3
|
wget -qO - http://www.nmon.net/apt-stable/ntop.key |
sudo apt-key add -
sudo apt-get update
|
STEP 3
Now install Ntopng and its dependencies.
|
1
2
|
sudo apt-get install libpcap-dev libglib2.0-dev libgeoip-dev redis-server libxml2-dev libnl1
sudo apt-get install ntopng pfring nprobe ntopng-data n2disk nbox
|
STEP 4
Ntopng is installed and now it’s time to create ntopng configuration file.
|
1
|
sudo nano /etc/ntopng/ntopng.conf
|
After running the above command copy all these lines into ntopng configuration file.
|
1
2
3
4
5
6
7
8
9
10
11
12
13
14
15
16
17
18
19
20
21
22
23
24
25
26
27
28
29
30
31
32
33
34
35
36
37
38
39
40
41
42
43
44
45
46
47
48
49
50
51
52
53
54
55
56
57
58
59
60
61
62
|
# /etc/ntopng/ntopng.conf
#
# The configuration file is similar to the command line, with the exception that an equal
# sign ‘=’ must be used between key and value. Example: -i=p1p2 or --interface=p1p2 For
# options with no value (e.g. -v) the equal is also necessary. Example: “-v=” must be used.
#
# - G|--pid-path
# Specifies the path where the PID (process ID) is saved.
#
-G=/var/tmp/ntopng.pid
#
# -e|--daemon
# This parameter causes ntop to become a daemon, i.e. a task which runs in the background
# without connection to a specific terminal. To use ntop other than as a casual monitoring
# tool, you probably will want to use this option.
#
-e=
#
# -i|--interface
# Specifies the network interface or collector endpoint to be used by ntopng for network
# monitoring. On Unix you can specify both the interface name (e.g. lo) or the numeric
# interface id as shown by ntopng -h. On Windows you must use the interface number instead.
# Note that you can specify -i multiple times in order to instruct ntopng to create multiple interfaces.
#
-i=1
#
# -w|--http-port
# Sets the HTTP port of the embedded web server.
#
-w=3000
#
# -m|--local-networks
# ntopng determines the ip addresses and netmasks for each active interface. Any traffic on
# those networks is considered local. This parameter allows the user to define additional
# networks and subnetworks whose traffic is also considered local in ntopng reports. All other hosts are considered remote. If not specified the default is set to 192.168.1.0/24.
#
# Commas separate multiple network values. Both netmask and CIDR notation may be used, even mixed together, for instance “131.114.21.0/24,10 .0.0.0/255.0.0.0”.
#
-m=192.168.1.0/24
#
# -n|--dns-mode
# Sets the DNS address resolution mode: 0 - Decode DNS responses and resolve only local
# (-m) numeric IPs 1 - Decode DNS responses and resolve all numeric IPs 2 - Decode DNS
# responses and don’t resolve numeric IPs 3 - Don’t decode DNS responses and don’t resolve
#
-n=1
#
# -S|--sticky-hosts
# ntopng periodically purges idle hosts. With this option you can modify this behaviour by telling ntopng not to purge the hosts specified by -S. This parameter requires an argument that can be “all” (Keep all hosts in memory), “local” (Keep only local hosts), “remote” (Keep only remote hosts), “none” (Flush hosts when idle).
#
-S=
#
# -d|--data-dir
# Specifies the data directory (it must be writable). Default directory is ./data
#
-d=/var/tmp/ntopng
#
# -q|--disable-autologout
# Disable web interface logout for inactivity.
#
-q=
|
STEP 5
You can also download ntopng from their website and install it manually by using the following command if you don’t want to add its repo.
|
1
2
3
4
5
|
$ tar xzf ntopng-1.0.tar.gz -C ~
$ cd ~/ntopng-1.0/
$ ./configure
$ make geoip
$ make
|
STEP 6
We also need to create ntopng.start file by using the command:
|
1
|
sudo nano /etc/ntopng/ntopng.start
|
Once you created ntopng.start file then add the following lines
|
1
2
3
|
--local-networks “192.168.0.0/24”
##give your local IP Ranges here.
--interface 1
|
STEP 7
To see all available interfaces and options, use the ntopng -h option:
|
1
|
sudo ntopng-h
|
STEP 8
Start Ntopng and redis server daemon.
|
1
2
|
sudo service redis-server start
sudo service ntopng start
|
STEP 9
Now you can test your ntopng application by typing http://yourserver.name:3000. You will see ntopng login page.
STEP 10
For the first time, your deafult credentials are user ‘admin’ and password ‘admin’. Once you login, you will see the dashboard with a glance of real traffic on your network.
STEP 11
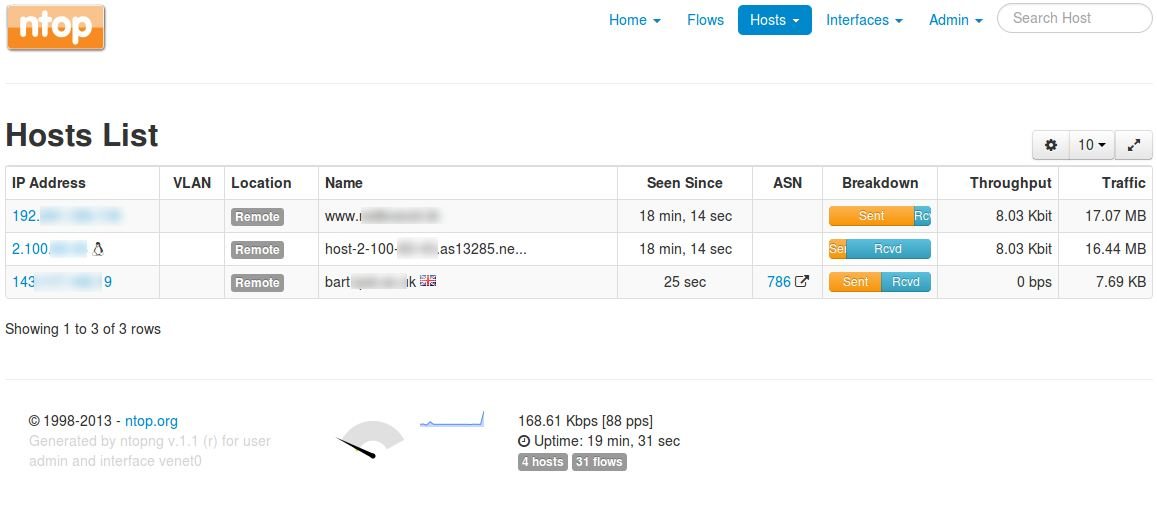
Click on the Host option to see the traffic and details of all the active hosts on your network.
STEP 12
You also get the graphical representation of traffic flow, hosts, ports, and applications and can monitor your network bandwidth consumption in a graphical way. (Source: PC Quest)
You May Want to See :
-
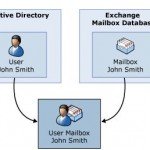 Why is Exchange Mailbox Not Receiving Email from External IDs?
-
 Wireshark Tutorial to Analyse traffic
-
 Building A Website With Phoenix Framework
-
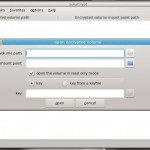 Encrypt drives with zuluCrypt
-
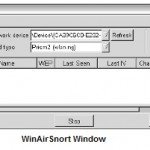 How To Use AirSnort to crack WEP keys
-
 Hacking Wi-Fi with Kali Linux
-
 Use the Task Manager to keep track of Application Use
-
 How to track your run with the Apple Watch
-
 Three Essential Ways To Improve Composition
-
 8 Ways To Optimise Your Wordpress Site
-
 Stay Safe on Public Wi-Fi
-
 Hacking Wireless Networks
-
 How To Connect Raspberry Pi To A Network
-
 Extend Your Wordpress Theme With WP Child Themes
-
 10 Tips to Speed Up Your Home Networking Connection
-
 How To Install MySQL on Linux, Windows, And Mac
-
 Protect Your Data Using BitLocker
-
 Double Your Battery Life
-
 Secure your site with a free SSL Certificate
-
 How To Setup eBay Account
-
 Share your gameplay on YouTube with Google’s Streaming Service


